Stop Guessing Where Your Jira Workflow Slows Down: Introducing Time in Status Custom Field for Jira
Tired of Jira issues (work items) stuck in certain statuses, hidden from view until it’s too late? Our Time in Status custom field for Jira…
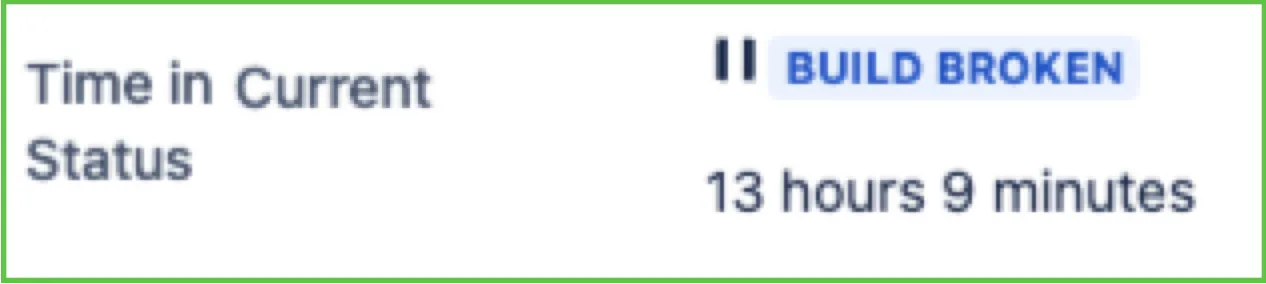
Tired of Jira issues (work items) stuck in certain statuses, hidden from view until it’s too late? Our Time in Status custom field for Jira gives you visibility into exactly how long each issue has spent at different stages of your pipeline.
The Problem: Blind Spots in Your Workflow
Without precise time in status time tracking, critical questions remain unanswered:
- How long has that bug been sitting in “Ready to Test”?
- Which user stories have been blocked for over a week?
- Are issues getting stuck in code review longer than expected?
These blind spots lead to missed SLAs, frustrated stakeholders, and delivery delays that could have been prevented.
The Solution: Precision Time Tracking with Full JQL Power
Our Time in Status custom field transforms how you monitor and optimize your workflow. This feature transforms your visibility from reactive to proactive, empowering your team to pinpoint bottlenecks, address aging issues promptly, and make data-driven decisions. Here’s what makes it powerful:
Track What Matters to You
Create multiple field instances to track different statuses independently across projects or issue types. Whether you need to monitor:
- Static/Specific statuses: You can create a field to always track the time spent in a specific status, like “In Progress”.
- Dynamic statuses: Monitor time in “Current Status” or “Previous Status” as issues move through your workflow.
- Status groups: Aggregate time across multiple related statuses for higher-level workflow analysis.
Status Groups: Track Time Across Related Statuses
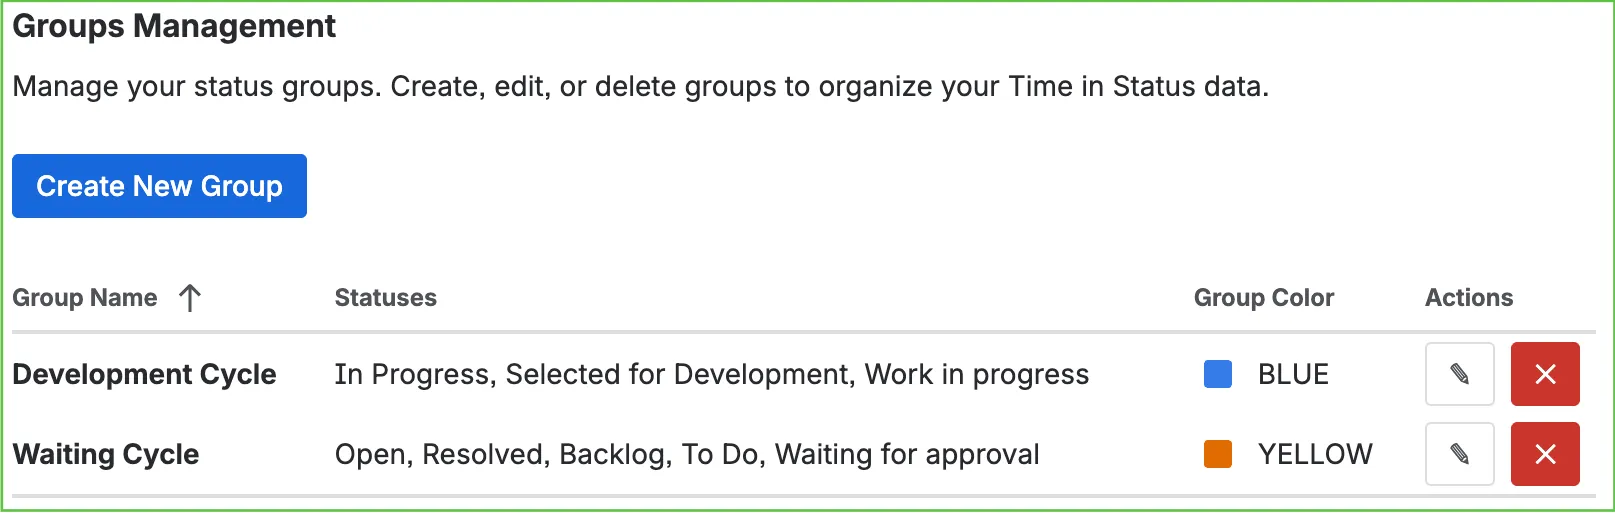
Status groups are powerful when you need to track time spent in conceptually related states rather than individual statuses. Create custom aggregations from your existing statuses and assign them meaningful names and colors.
Example use cases:
External Dependencies Group (“External Wait”)
- “Waiting on Customer”
- “Waiting on Third Party”
- “Pending External Approval”
Track total time your team is blocked by factors outside their control. Perfect for identifying when external dependencies are your primary bottleneck.
Active Development Group (“Work Pipeline”)
- “In Progress”
- “Code Review”
- “Fixing Review Comments”
Measure total active development time regardless of internal workflow transitions. Get true cycle time from start to deployment-ready.
Quality Assurance Group (“Testing Phase”)
- “Ready for QA”
- “In Testing”
- “Regression Testing”
- “Failed QA”
Track the entire QA cycle as a single metric, regardless of how many times issues bounce between testing states.
Waiting States Group (“Idle Time”)
- “Backlog”
- “On Hold”
- “Blocked”
- “Waiting for Deployment”
Identify non-productive time and differentiate it from active work. Critical for accurate velocity and capacity planning.
Status groups support full JQL queries just like individual statuses, giving you powerful filtering capabilities across aggregated states.
Business Hours That Match Your Reality
Calendar configuration is critical because not all hours are equal. A ticket sitting in “Waiting for Review” over the weekend shouldn’t count the same as one waiting during business hours when your team is actually available to act on it.
Our built-in calendar support ensures time calculations reflect your team’s actual working reality:
Why calendar configuration matters:
- Accurate SLA tracking: Calculate time based on when your team is actually working, not 24/7 wall-clock time
- Fair metrics: Don’t penalize teams for time outside their control (nights, weekends, holidays)
- Regional differences: Support distributed teams with different working hours and holidays
- Realistic reporting: Get true bottleneck insights by filtering out non-working time
Flexible calendar features:
- Configure timezone-specific working hours (e.g., 9 AM to 5 PM)
- Split workdays for lunch breaks or flexible schedules
- Define holidays and non-working days
- Import ICS files for complex organizational calendars
- Create multiple calendars for different regions, teams, or support tiers
Flexible Calculation Methods
Choose the calculation approach that fits your needs:
- Total cumulative time: Track all time spent in a status across multiple transitions. If an issue enters “In Progress” three separate times, this method adds all three durations together.
- Last transition only: Focus on the most recent duration in that status. If an issue enters “In Progress” three separate times, this method only track the last transtion.
Powerful JQL Queries: Your Workflow Intelligence Engine
JQL support is what transforms Time in Status from a simple tracking field into a powerful workflow intelligence tool. Without JQL, you’re limited to viewing individual issues. With JQL, you can query across thousands of issues to identify patterns, bottlenecks, and opportunities for improvement.
Why JQL support matters:
Most time tracking solutions only let you view time data on individual issues. Our full JQL integration means you can:
- Build sophisticated filters and saved searches
- Create automated dashboards that update in real-time
- Set up alerts and notifications based on time thresholds
- Generate reports across projects, teams, or issue types
- Combine time data with any other Jira field for deep analysis
Two powerful JQL aliases:
**.running**(boolean): Filter issues currently in the configured status**.timeInMinutes**(numeric): Query cumulative time spent with comparison operators
Real-world JQL use cases:
1. Catch Aging Issues Before They Become Problems
"Time in Ready to Test".timeInMinutes > 4320 AND priority = HighFind high-priority items waiting in QA for over 3 days. Set this as a daily alert to catch bottlenecks early.
2. Identify Blocked Work Immediately
"Time in Blocked".running = true AND created < -7dShow all issues currently blocked that were created over a week ago. Perfect for stand-up meetings and retrospectives.
3. Optimize Code Review Processes
"Time in Code Review".timeInMinutes > 1440 ORDER BY "Time in Code Review".timeInMinutes DESCFind reviews taking longer than 24 hours, sorted by duration. Identify if specific reviewers, repositories, or issue types consistently slow down.
4. Track SLA Compliance
project = SUPPORT AND "Time in Waiting for Customer".timeInMinutes > 10080Find support tickets where customers haven’t responded in over a week. Automate follow-ups or escalations.
5. Sprint Planning with Historical Data
sprint in closedSprints() AND "Time in In Progress".timeInMinutes < 480Find stories completed within 8 hours of active development. Use this data to identify well-scoped work for future sprint planning.
6. Measure True Cycle Time
status = Done AND "Time in Active Development".timeInMinutes > 0 AND resolved >= -30dAnalyze actual development time (using a status group) for completed work in the last month. Compare against estimates to improve future planning.
7. Find Fast-Track Opportunities
"Time in Code Review".timeInMinutes < 120 AND reviewer = currentUser()Identify which of your reviews were completed quickly. Understand what makes reviews efficient to replicate that success.
8. Detect Workflow Inefficiencies
"Time in Waiting for Deployment".timeInMinutes > 2880 AND status != DoneFind issues that have been deployment-ready for over 2 days but aren’t shipped. Indicates deployment process bottlenecks.
9. Customer-Facing SLA Dashboards
project = SALES AND "Time in Pending Approval".running = false AND resolved >= startOfMonth()Track sales request processing times for monthly performance reviews. Combine with other fields for complete visibility.
10. Team Performance Analysis (Without Blame)
assignee = jsmith AND "Time in Current Status".timeInMinutes > 1440Help team members identify their own work that needs attention. Focus on process improvement, not finger-pointing.
Advanced: Combine Multiple Time Fields
"Time in Code Review".timeInMinutes > 960 AND "Time in In Progress".timeInMinutes < 480Find issues where review time exceeded development time by 2x. Suggests issues might be under-specified or reviewers lack context.
Dashboard and Automation Integration:
Since Time in Status fields support JQL, you can:
- Add them to issue navigator columns for quick scanning
- Build Jira dashboards with filters, pie charts, and gadgets
- Create automation rules triggered by time thresholds
- Export filtered data for external reporting tools
- Share saved filters with team members for consistency
The combination of precise time tracking with Jira’s powerful query language means you can ask, and answer, virtually any workflow performance question.
Real-World Use Cases
Identify bottlenecks: Create dashboards showing issues stuck in specific statuses beyond threshold times
Optimize code reviews: Track review duration and identify patterns that slow your team down
Meet SLAs: Set up alerts for issues approaching time limits in critical statuses
Sprint retrospectives: Analyze where time was actually spent versus estimates
Process improvement: Compare time in status across projects or teams to identify best practices