Implementing a Risk Register in Jira Using a Tabular Data Selection Field
Introduction
Risk management is a critical discipline for any project, but Jira’s built-in single and multi-select fields often fall short when it comes to helping users make informed decisions. When selecting a risk’s impact level or probability, users typically see only a simple list of options like “High”, “Medium”, or “Low”, without any context about what these values actually mean.
This leads to inconsistent risk assessments across teams, subjective interpretations that vary from person to person, and ultimately, a less reliable risk register.
Tabular Data Selection changes this by presenting field options in a rich, table-based interface where users can see multiple columns of information (including color coding, descriptions, examples, and thresholds) before making their selection.
The Problem with Traditional Select Fields
Consider a standard risk register setup in Jira. You create custom fields for Impact and Probability, each with options like:
- Critical
- High
- Medium
The problem? These labels are ambiguous. What does “High Impact” actually mean? Is it a $10,000 loss or a $1,000,000 loss? Is it a one-week delay or a six-month delay? Without clear definitions visible at the moment of selection, different team members will interpret these values differently.
The Solution: Contextual Selection with Tabular Data
Tabular Data Selection displays your field options as rows in a table, with each column providing additional context. For risk management, this means users can see the full picture before they click. Instead of a simple dropdown, present impact levels with full context.
Impact Selection
Lets configure impact selection for a risk item to use contextual information.
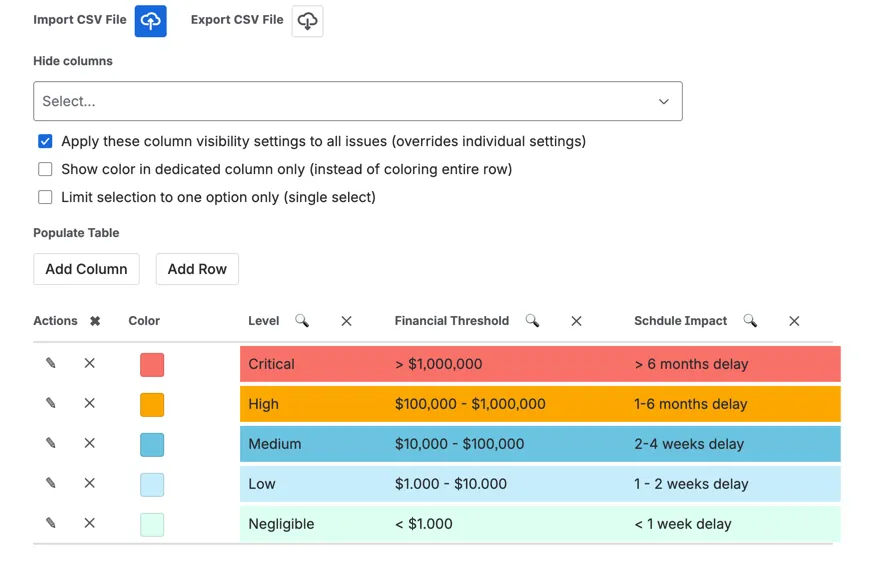
Now when a user selects an impact level, they’re guided by concrete examples and thresholds, reducing guesswork and improving consistency across the organization. This custom field configuration is defined once by the Jira administrators.
Probability/Likelihood Selection
Probability assessments benefit equally from contextual information:
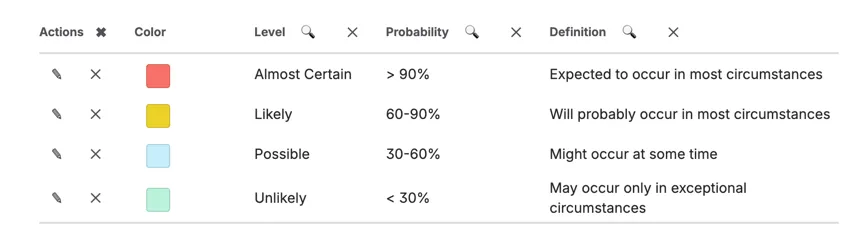
The percentage ranges and plain-language definitions help calibrate user expectations and ensure that “Likely” means the same thing to everyone. Just for demonstration, lets configure color as a separate column instead of highlighting the whole row.
Risk Category Selection
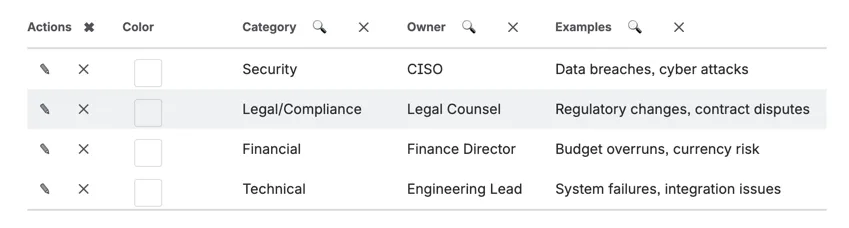
Risk categories help organize and route risks to the right teams, this time we are not using any coloring.
Creating the Risk Issue
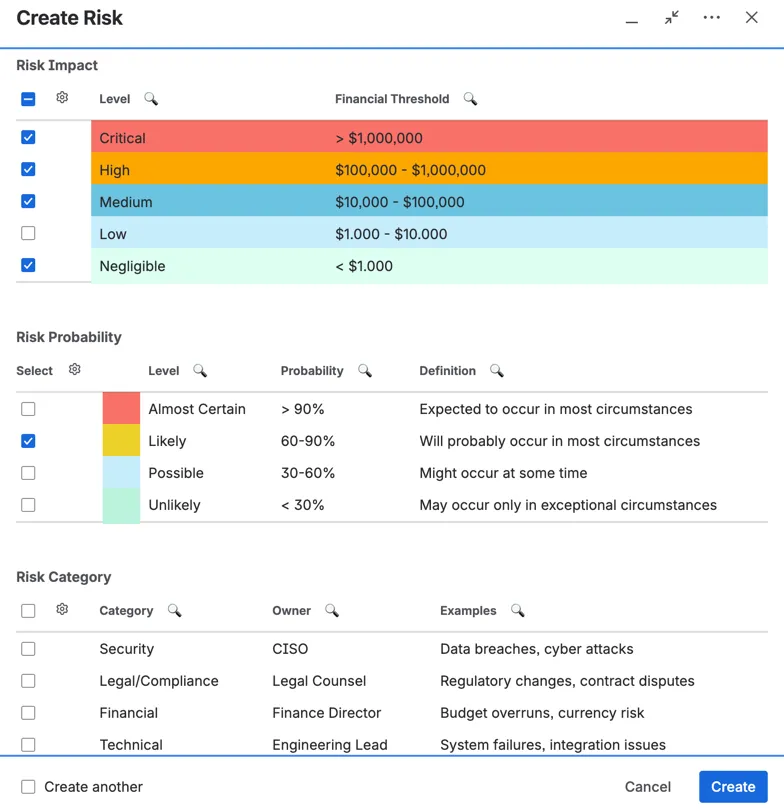
After this, you can add custom fields to your issue screen and enjoy the rich context and visual appeal provided by Tabular Selection Custom Field.
Benefits for Your Organization
1. Consistency: Clear definitions visible at selection time reduce subjective interpretation
2. Training Reduction: New team members can make accurate assessments immediately without memorizing criteria
3. Visual Hierarchy: Color-coded rows/cell provide instant visual feedback about severity
4. Audit Trail: Selections are based on documented criteria, making risk assessments more defensible
5. Flexibility: Customize columns to match your organization’s risk framework and terminology
Getting Started
Tabular Data Selection is available as part of the Custom Fields++ or Tabular Data Selection Field on the Atlassian Marketplace. Custom Fields++ contains “Tabular Data Selection Field” in addition to lots of other fields. To implement a risk register:
• Create a new Tabular Data Selection field for each risk attribute (Impact, Probability, Category, etc.)
• Define your columns based on your organization’s risk framework
• Populate the rows with your risk levels, including descriptions, thresholds, and color codes
• Add the fields to your issue screens and start capturing better risk data
For detailed setup instructions, visit our documentation or reach out to our support team.