Using Jira Sum-Up Fields in JQL, the Issue Navigator, and Dashboards
This is the third post on the Sum-up Custom Field for Jira. In the first post we built a single rollup: an “Expand into the EU Market” Goal…
This is the third post on the Sum-up Custom Field for Jira. In the first post we built a single rollup: an “Expand into the EU Market” Goal whose Estimated Cost added itself up through six levels to a Total Estimated Cost of 63,200, with nobody adding a number by hand. In the second post we changed the calculation method and turned that same field into four more answers: a Max for the biggest single line, a Min for the smallest, an Average for the typical one, and a Count for how many lines were even filled in. Both posts left the value sitting on one parent issue, which is useful to look at but not yet something you can search, report on, or put on a dashboard. That is what this post is about: once a Sum-up value is calculated, it behaves like any other Jira number, so JQL, the Issue Navigator, dashboard gadgets, and a dedicated grid view all open up at once.
First, make sure the values are calculated
There’s one prerequisite worth stating up front, and it’s easy to get wrong. A Sum-up value is calculated and written the moment an issue’s view is opened, so it happens live, per issue, with no sync required for any issue you actually open. What the Calculate Issues pass from the first post adds is that same calculation run across every issue at once, so you don’t have to open each one to populate it. The distinction matters for search: JQL and the Issue Navigator can only match issues whose value has already been calculated, so an issue you’ve never opened and never synced simply won’t turn up in a query yet. Run the bulk pass once and every issue carries its value. Either way the field is stored as an ordinary number, which is what lets JQL compare it with greater-than and less-than and lets the Issue Navigator sort and export it.
Filtering with JQL: three questions worth saving
Because the field is a plain number, you write JQL against it exactly as you would any numeric field, with three small rules that trip people up:
- No thousand separators. Write
10000, never10,000or10.000; the separators you set for display don’t belong in the query. - Time is stored in seconds. If the source is a time-tracking field, one hour is
3600, so “under an hour” is< 3600. - Decimals use a dot. A half-point is
50.5, whatever the field renders on screen.
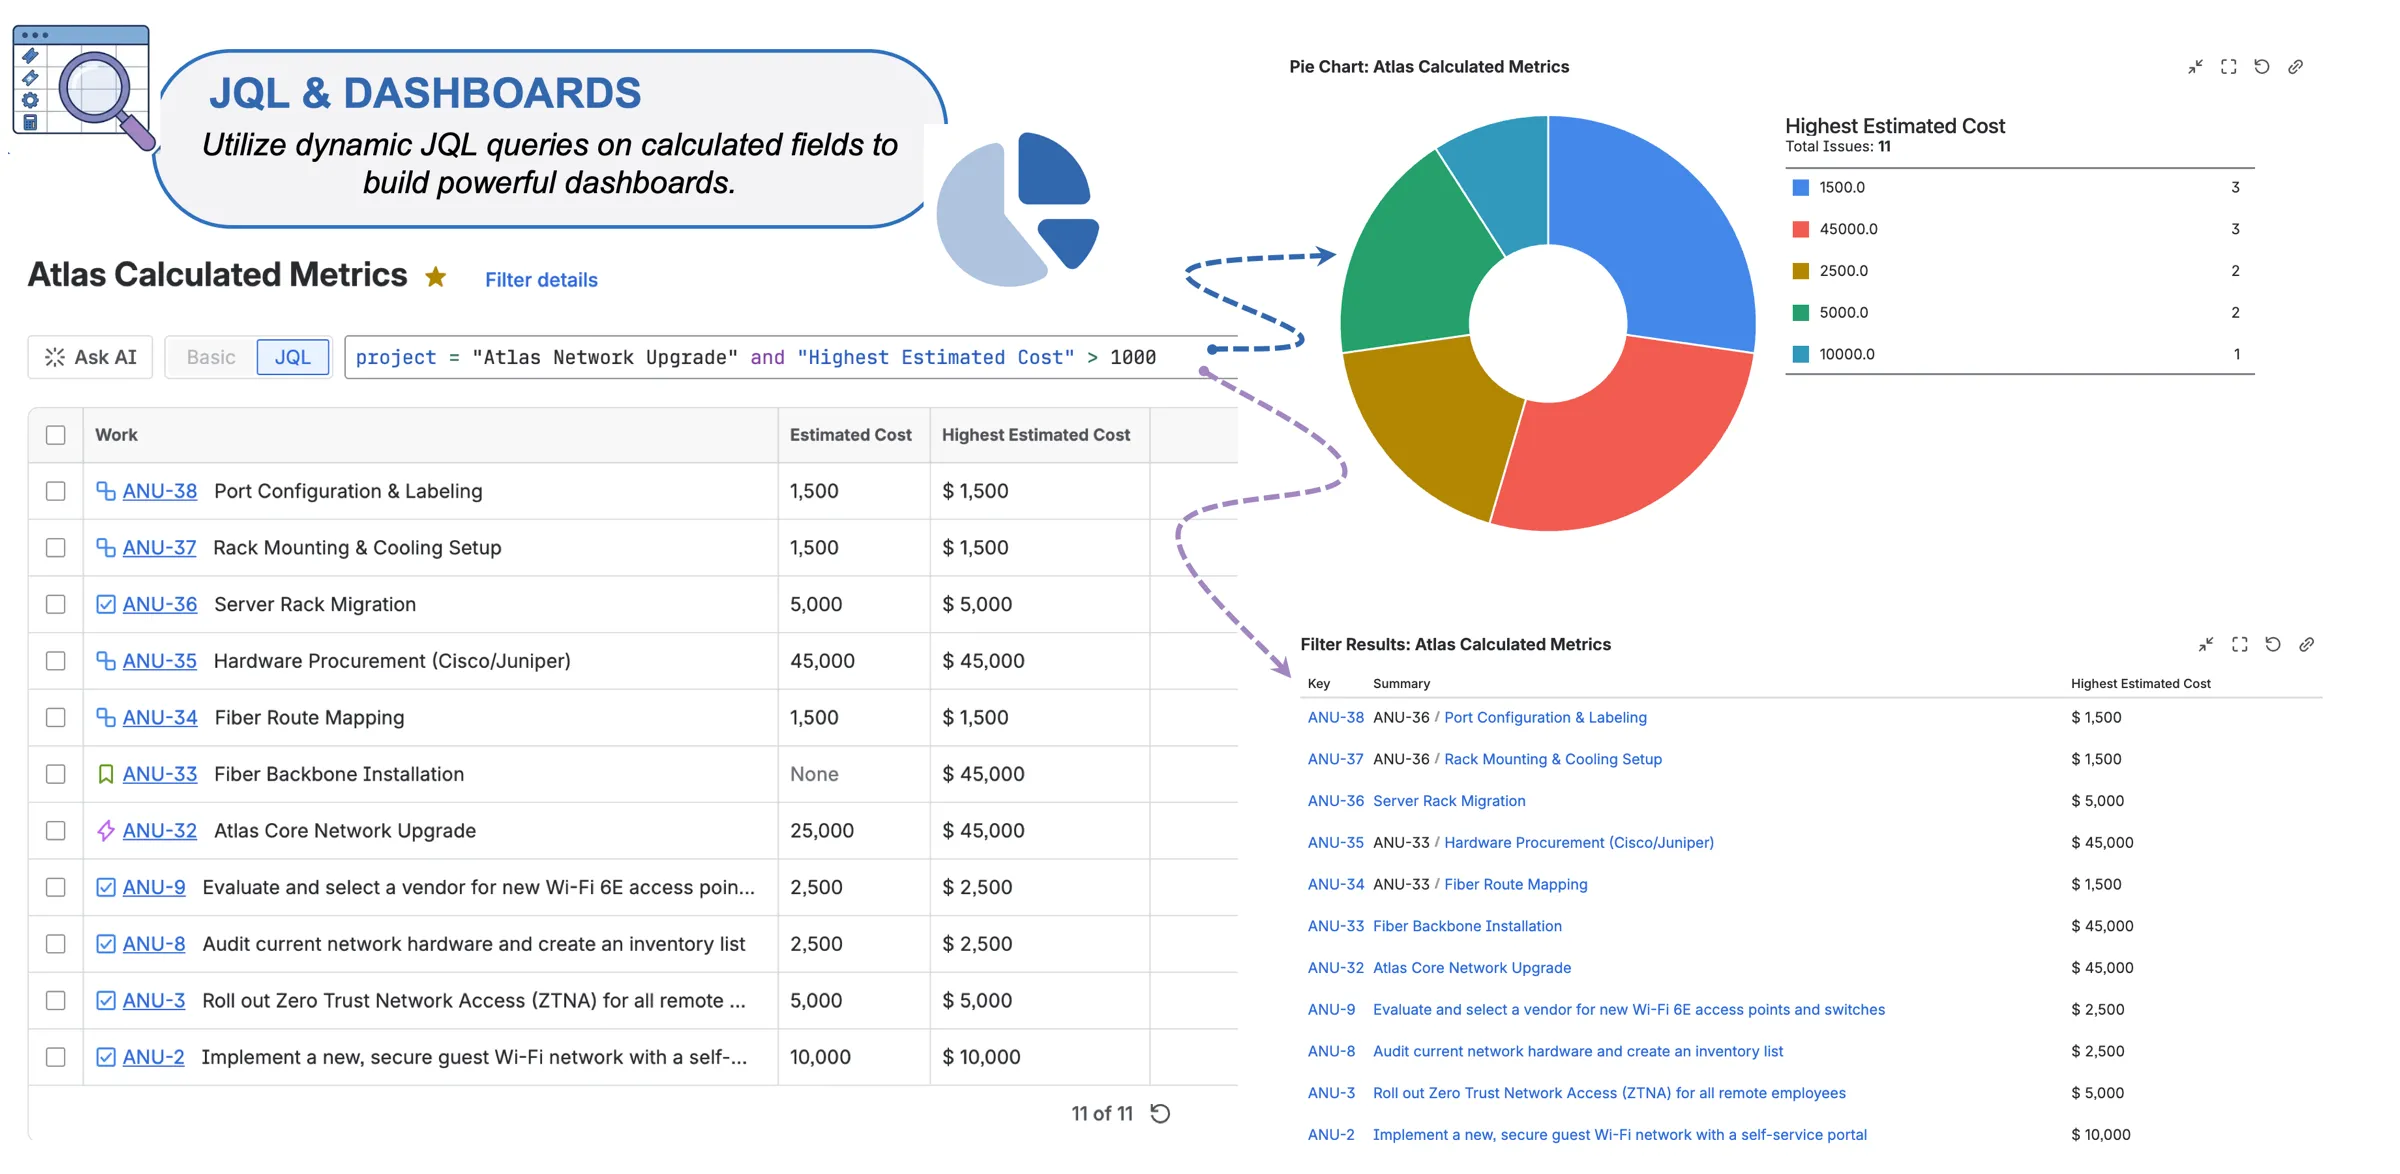
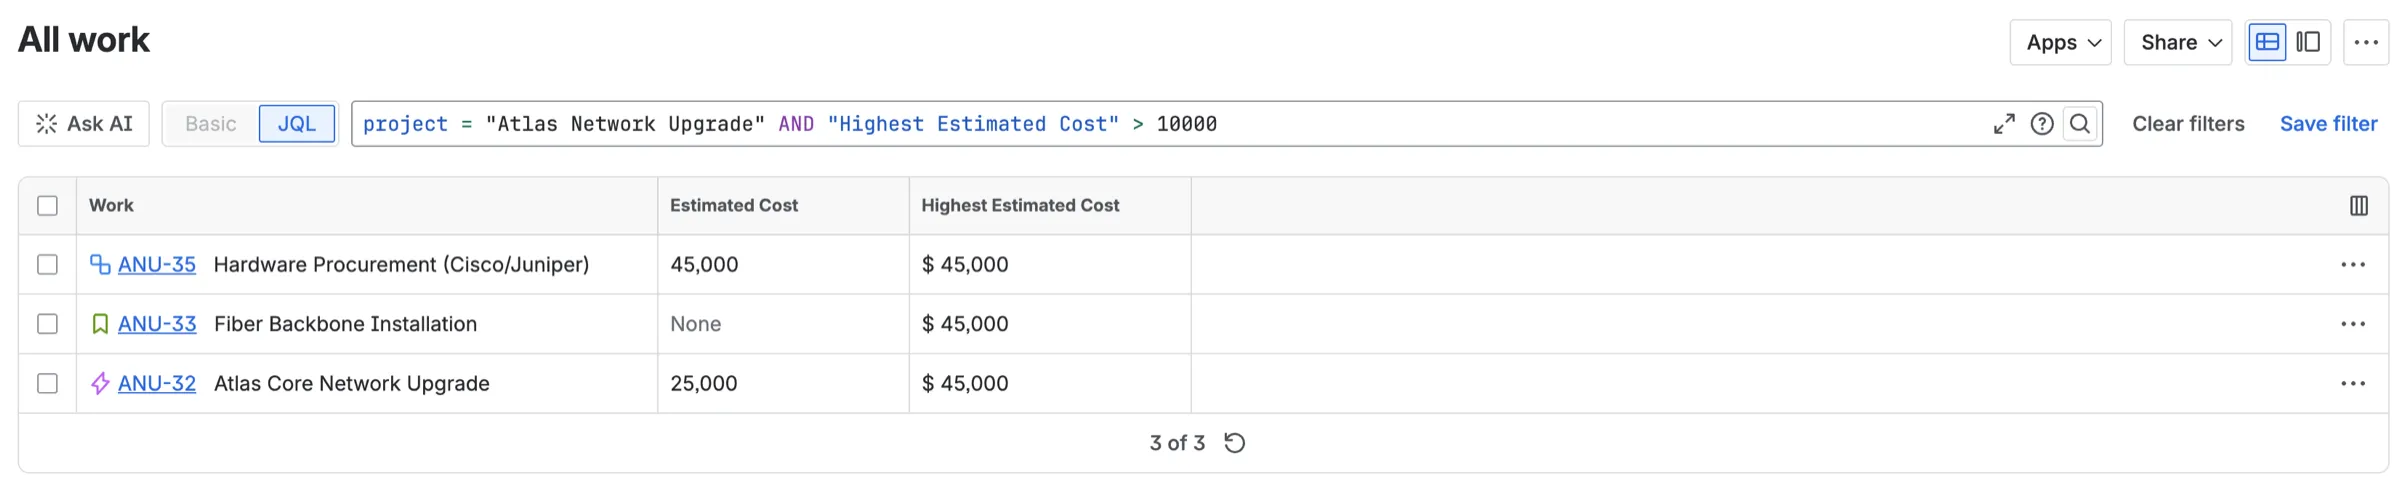
With those in hand, the same fields you configured in the earlier posts start answering real questions across a whole project. To flag budget risk, project = "Atlas Network Upgrade" AND "Highest Estimated Cost" > 10000 returns every parent issue with at least one descendant estimated above 10,000, the ones that deserve a closer look before sign-off.
Dashboards
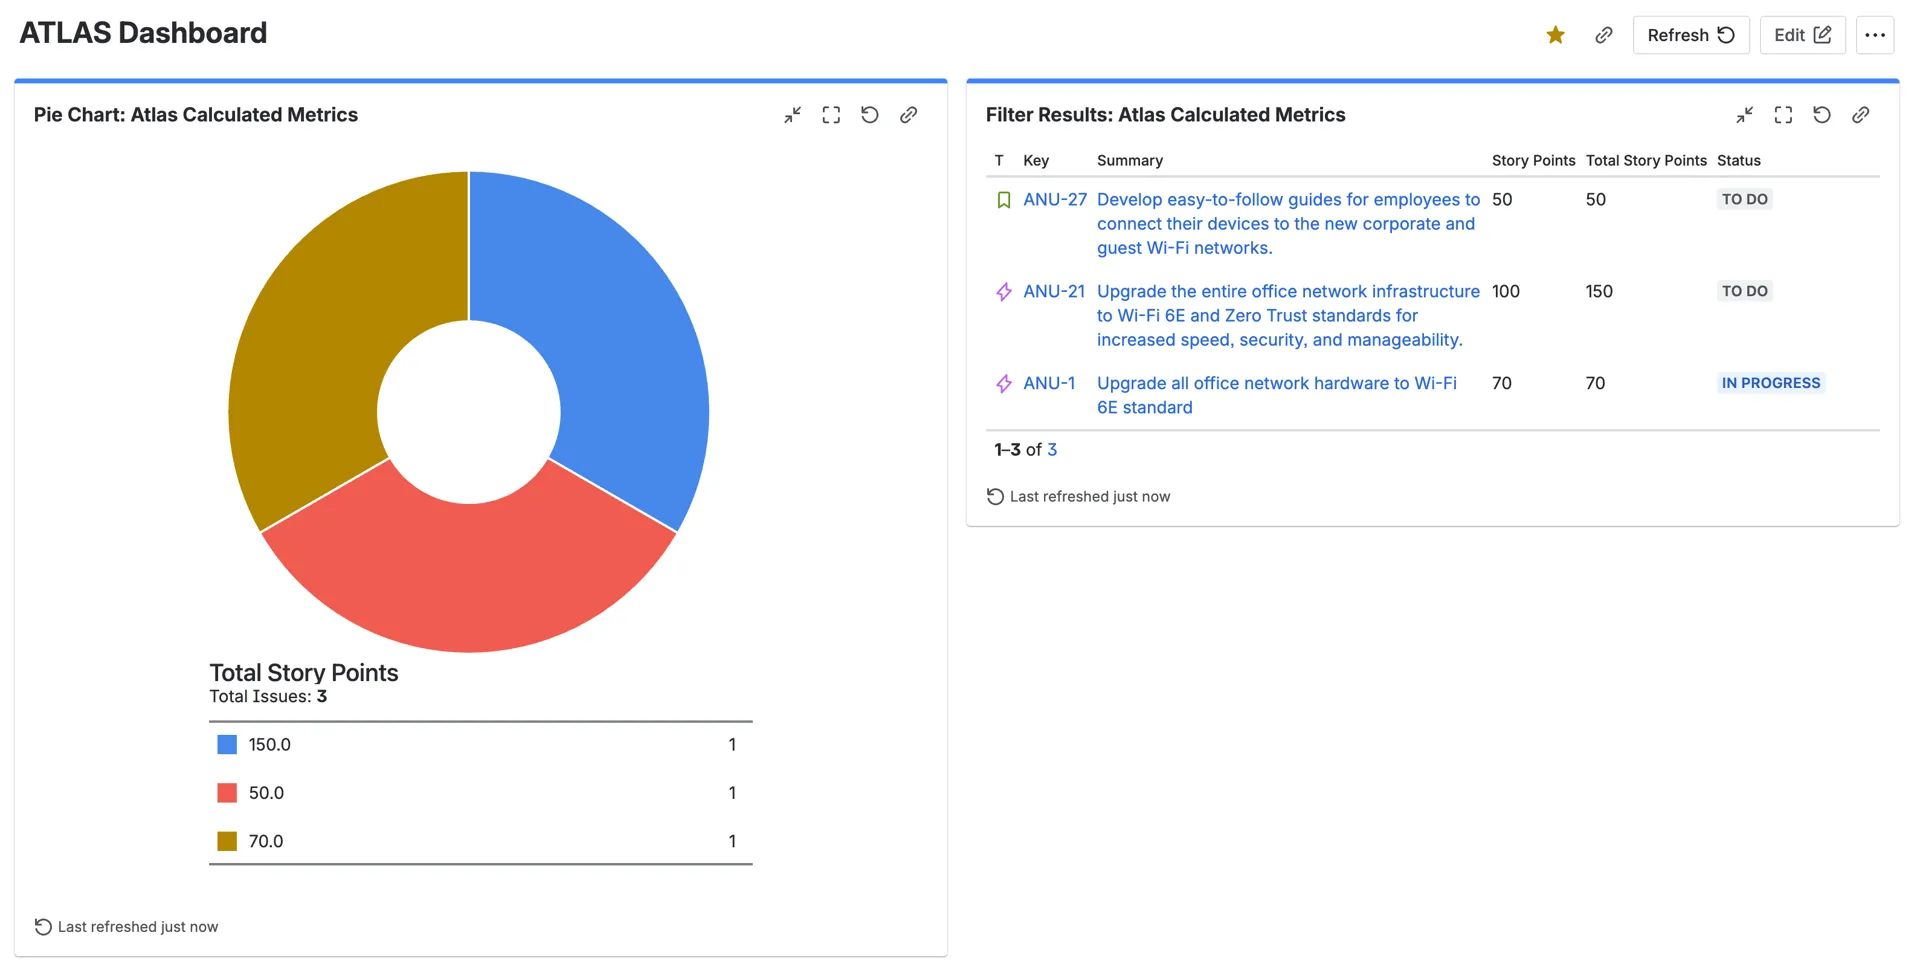
A saved filter is also the seed for a dashboard. Take the overload query from above, save it as something like “Atlas Calculated Metrics”, and point Jira’s native gadgets at it. A Filter Results gadget turns it into a live list on your dashboard, and a pie chart gadget breaks the same issues down visually. None of this is special to the Sum-up field, and that’s the point: because the value is a standard number, every gadget that already works with Jira numbers works with your rollups, and the figure you used to add up by hand now updates on a dashboard nobody has to remember to open.
The Sum Up Fields Navigator App: every calculation in one grid
For a review across many issues at once, the app adds a dedicated view. From the sidebar choose Filters → Search work items to open issue search, then open the Apps dropdown next to Share and pick Sum Up Fields Navigator; whatever your current filter returns is redrawn as a grid. Each row is an issue and each column is one of your Sum-up fields, so you can audit every configured calculation, a total time here, a Max cost there, without opening a single issue.
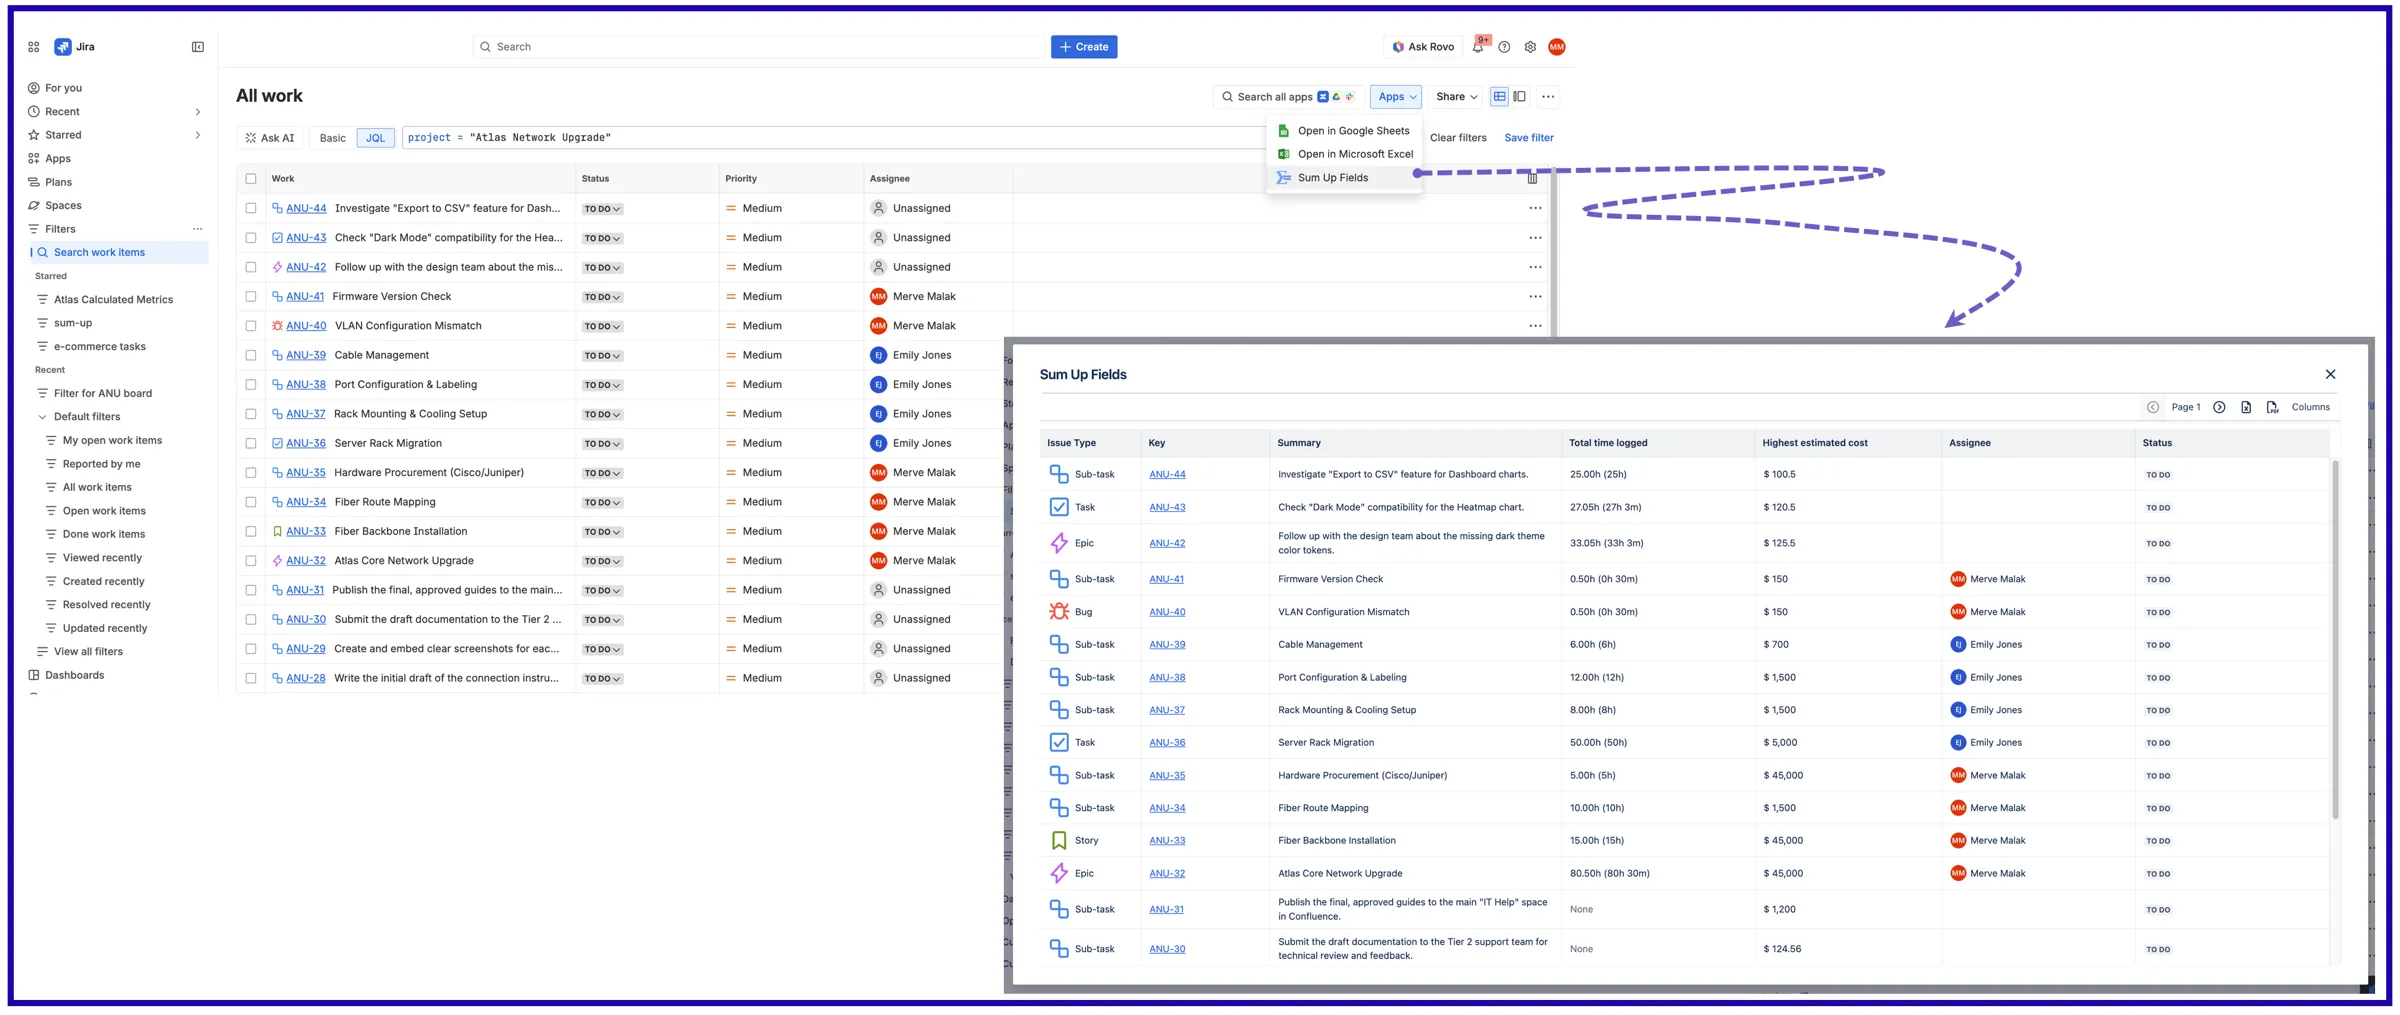
Every cell is either the calculated value, formatted with the units and separators you configured (a time field might read 25.00h (25h), a cost field $ 1,500), or an empty “None” when an issue has no children to roll up or no value entered. You can extend the grid with Priority, Assignee, or Status columns and export the whole thing to Excel or PDF from the toolbar.
One quirk is worth knowing before you export, especially if you work in Turkish or German: the export engine folds accented characters to their plain equivalents (ı becomes i, ü becomes u), strips emojis, and drops non-ASCII symbols like Σ, so text that leaned on those will read a little differently in the file than it does on screen.
Try the Sum-up Custom Field on the Atlassian Marketplace and turn a number you used to look up by hand into one your JQL, dashboards, and reports keep an eye on for you.