Average, Min, Max, and Count in the Sum-up Custom Field
In our earlier post about the Sum-up Custom Field for Jira, we followed an “Expand into the EU Market” Goal, a six-level plan whose…
In our earlier post about the Sum-up Custom Field for Jira, we followed an “Expand into the EU Market” Goal, a six-level plan whose Estimated Cost rolled all the way up to a single Total Estimated Cost of 63,200 without anyone adding a number by hand. That was a total question: how much does the whole plan cost. Not every rollup you need is a total though.
The other four methods
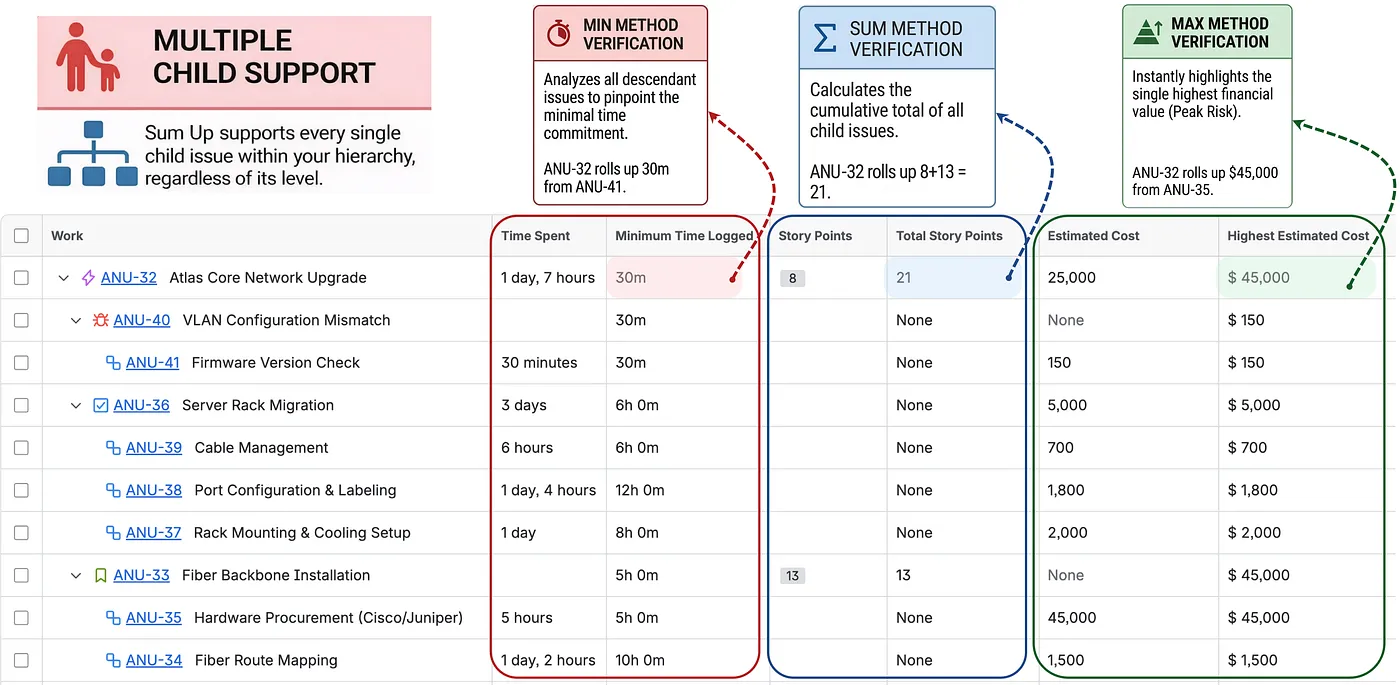
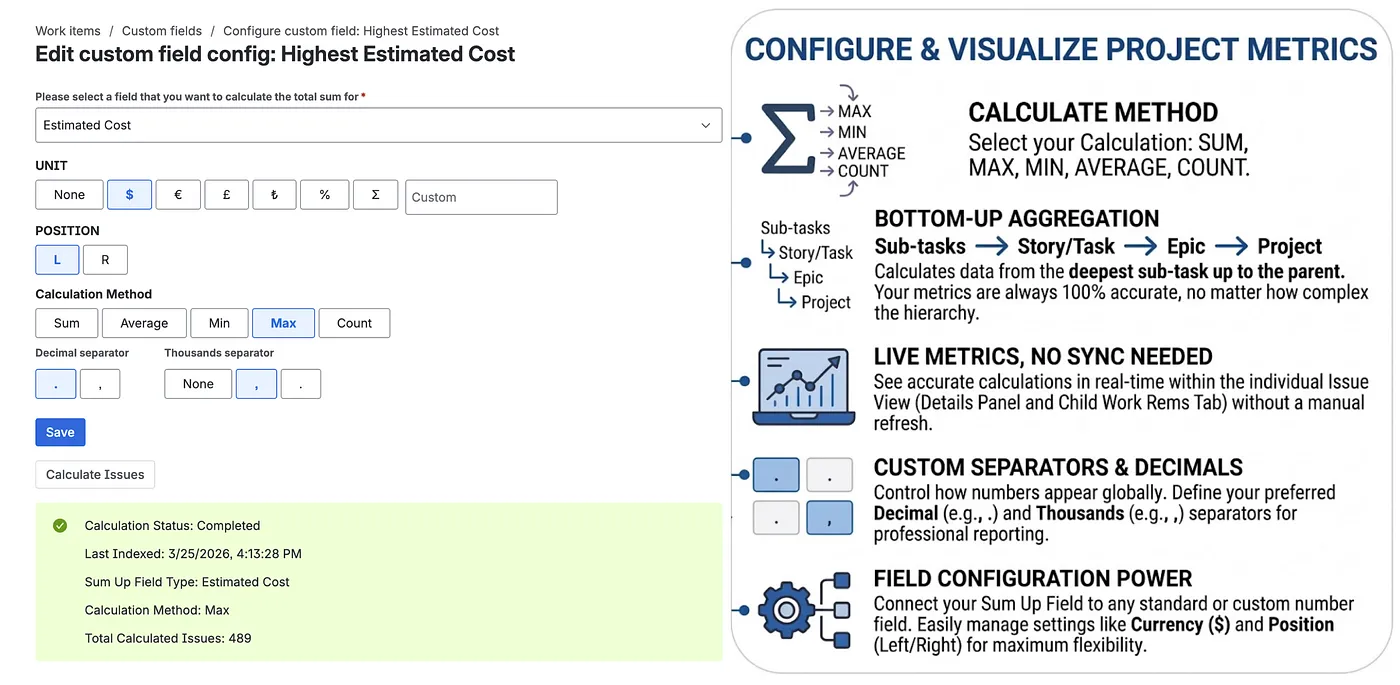
Calculation Method sits right below the field picker on the Sum-up Custom Field’s configuration screen. It’s a toggle between five different questions you can ask of the same hierarchy:
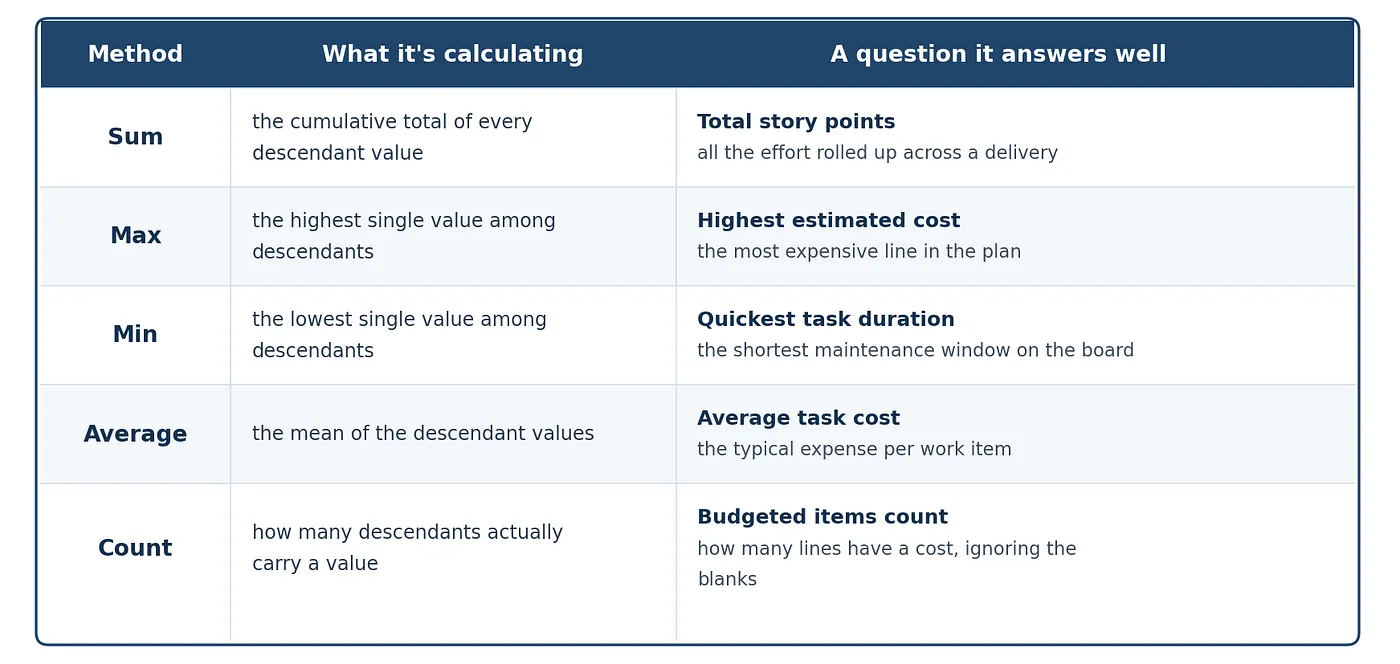
- Sum: adds every value across all descendant issues, the right choice for anything additive: cost, story points, time logged.
- Average: divides the total by how many issues actually carry a value, useful when you care about a typical size rather than a combined one, like the average cost per line item.
- Min: surfaces the smallest value found anywhere in the hierarchy, handy for the earliest deadline or the smallest work package.
- Max: surfaces the largest value, the one to reach for when a single outlier matters more than the group, a biggest single cost or a worst-case risk score.
- Count: counts how many descendant issues actually have a value set, not their size, which answers how many items are filled in rather than how big they are.
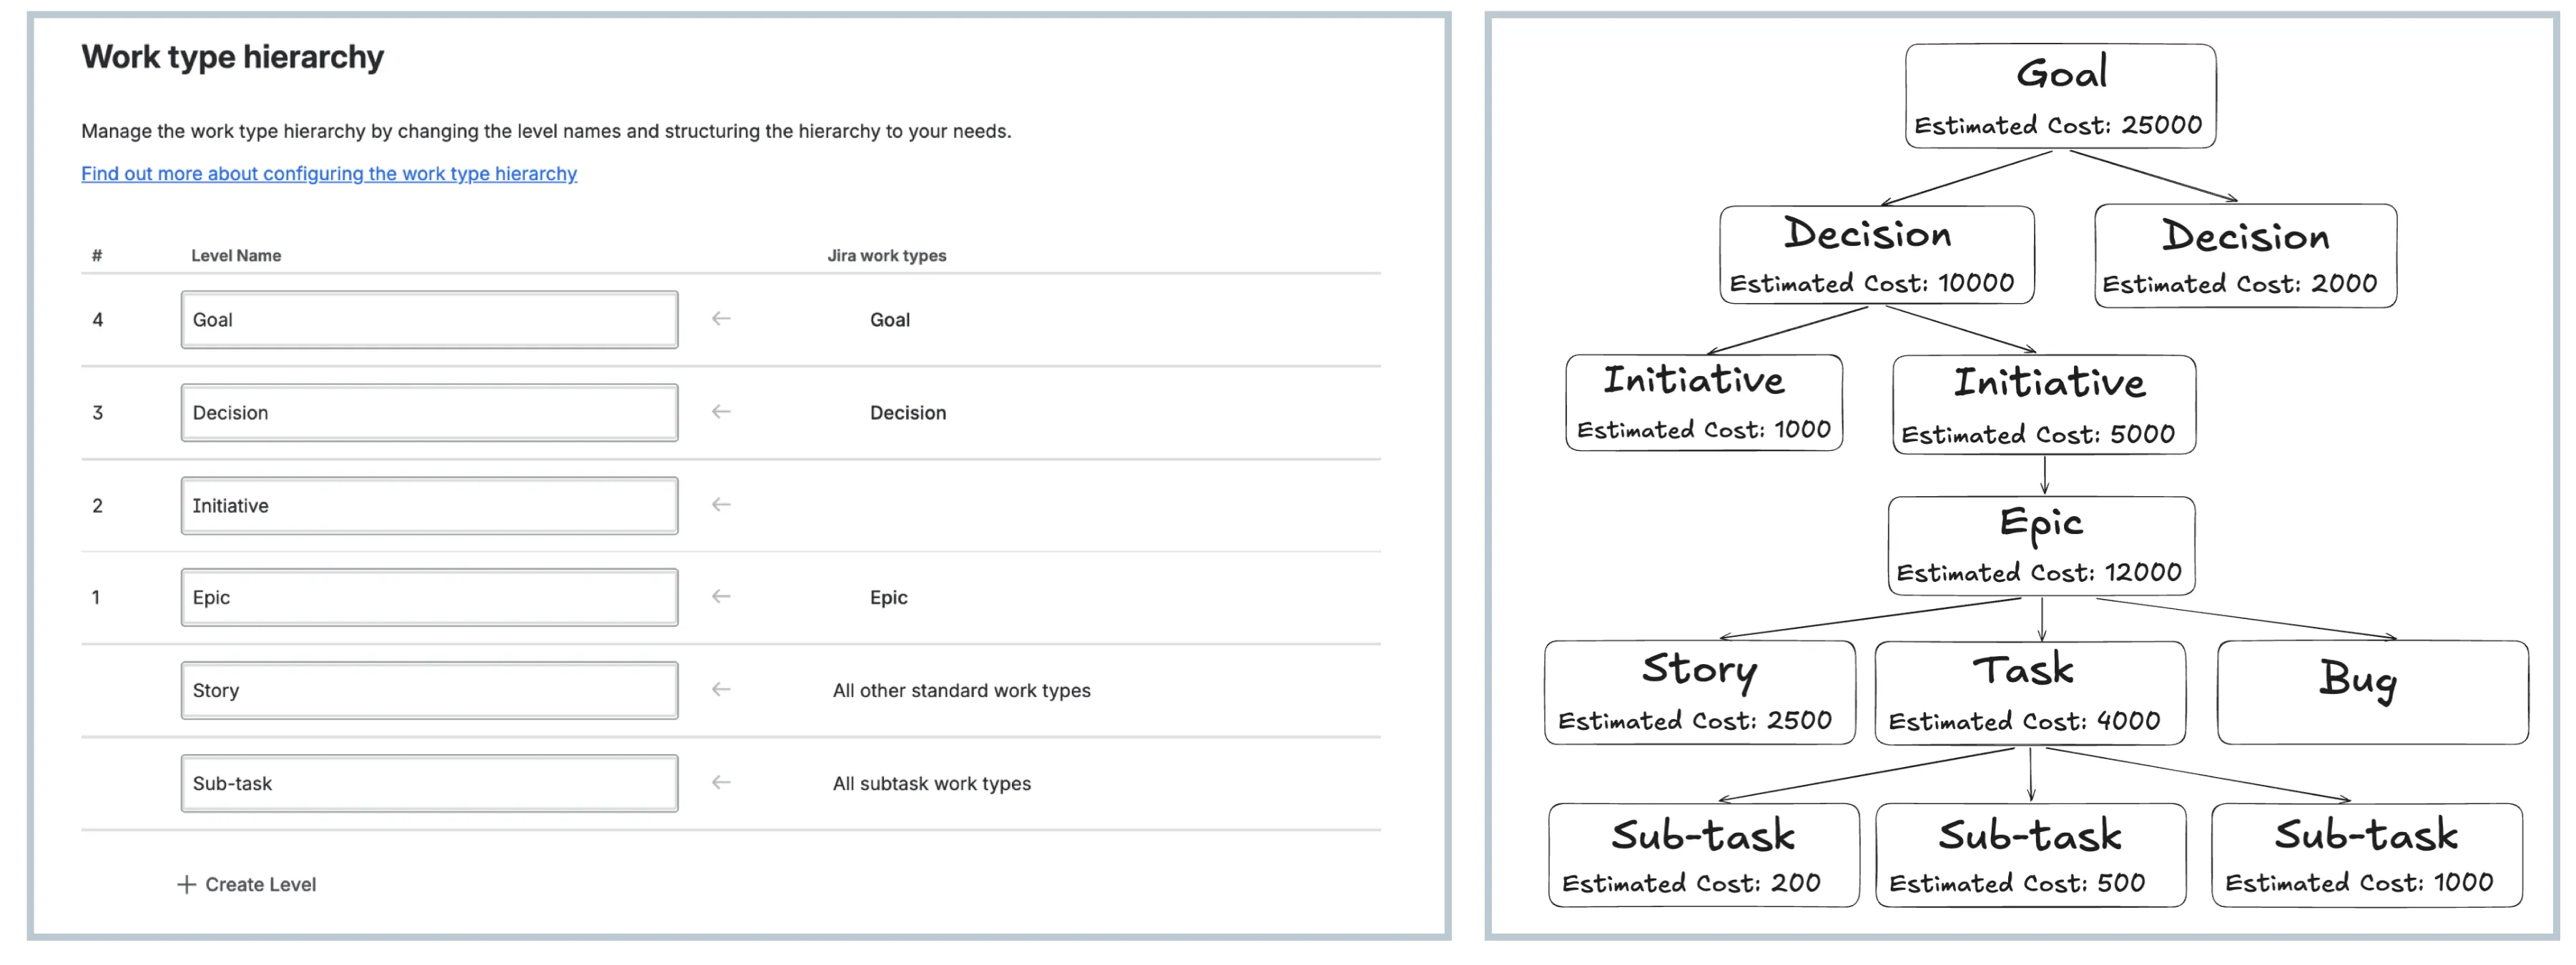
The clearest way to feel the difference is to run all five against one tree, so take the exact EU Market plan from the previous post. A Goal, two Decisions, two Initiatives, an Epic, a Story, a Task, three Sub-tasks, and one still-uncosted Bug each carry an Estimated Cost, and the same eleven numbers produce five completely different answers depending on the method you choose. You already saw Sum come out to 63,200 in the previous post; here are the other four on the same tree:
MAX:
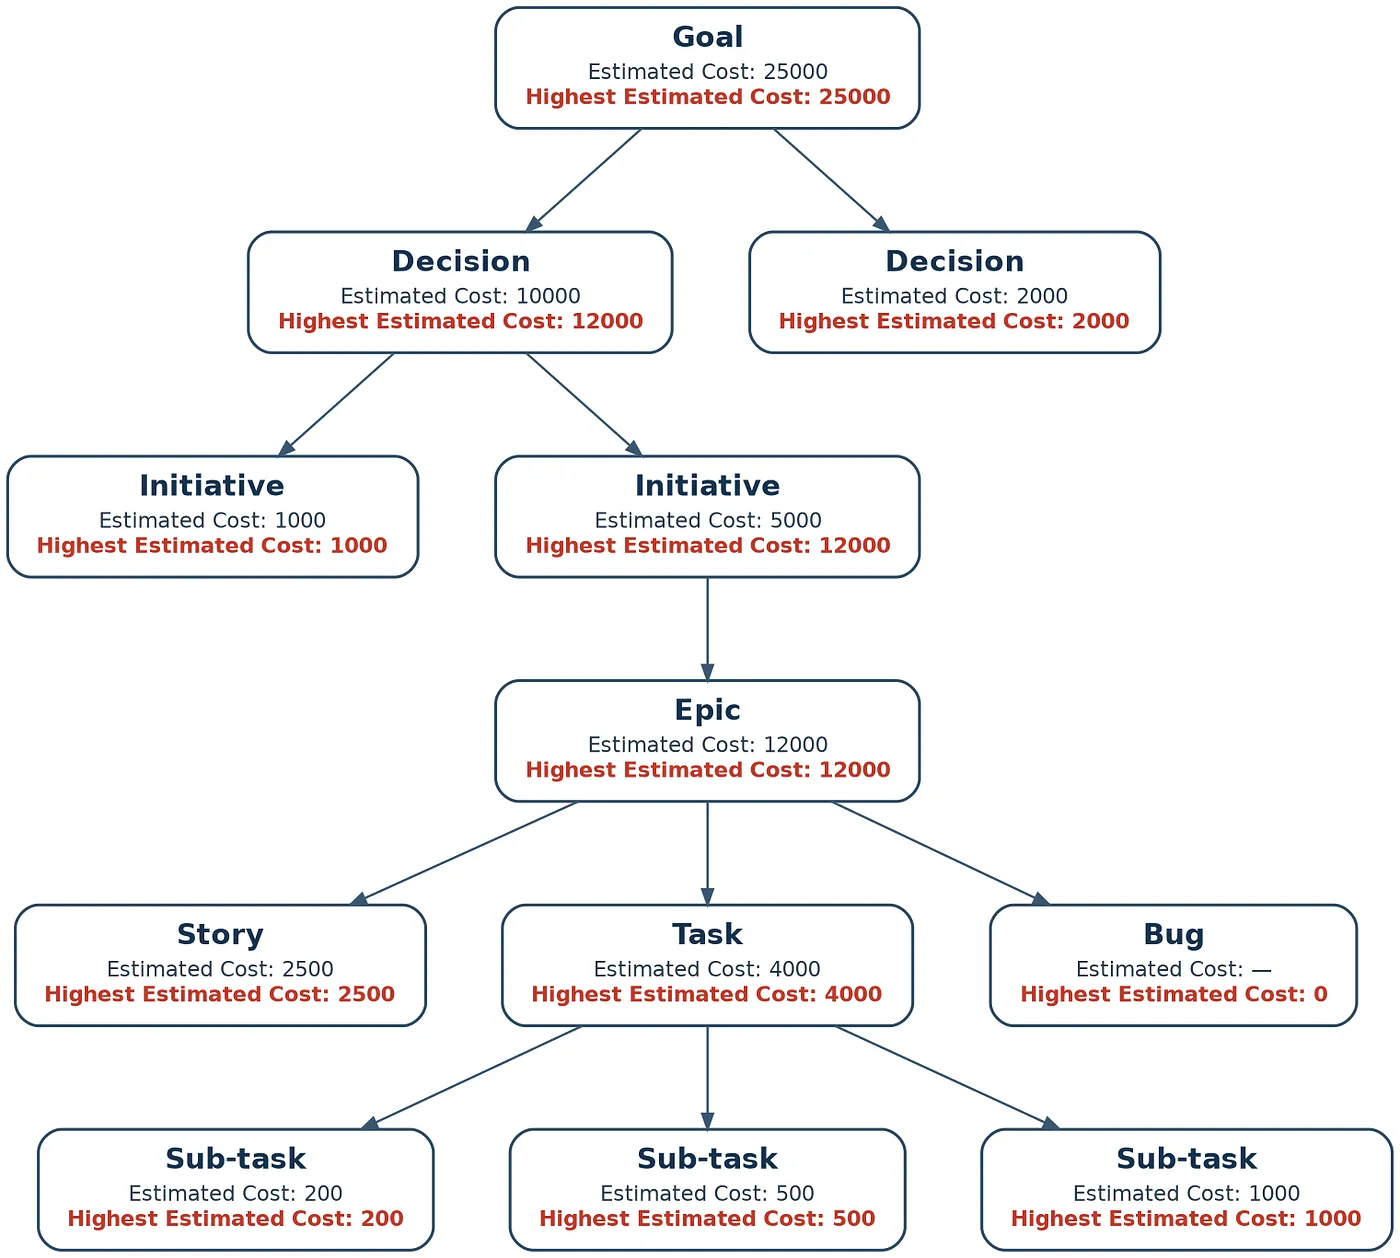
- The single largest value anywhere in the tree
- Goal Highest Estimated Cost: 25,000
MIN:
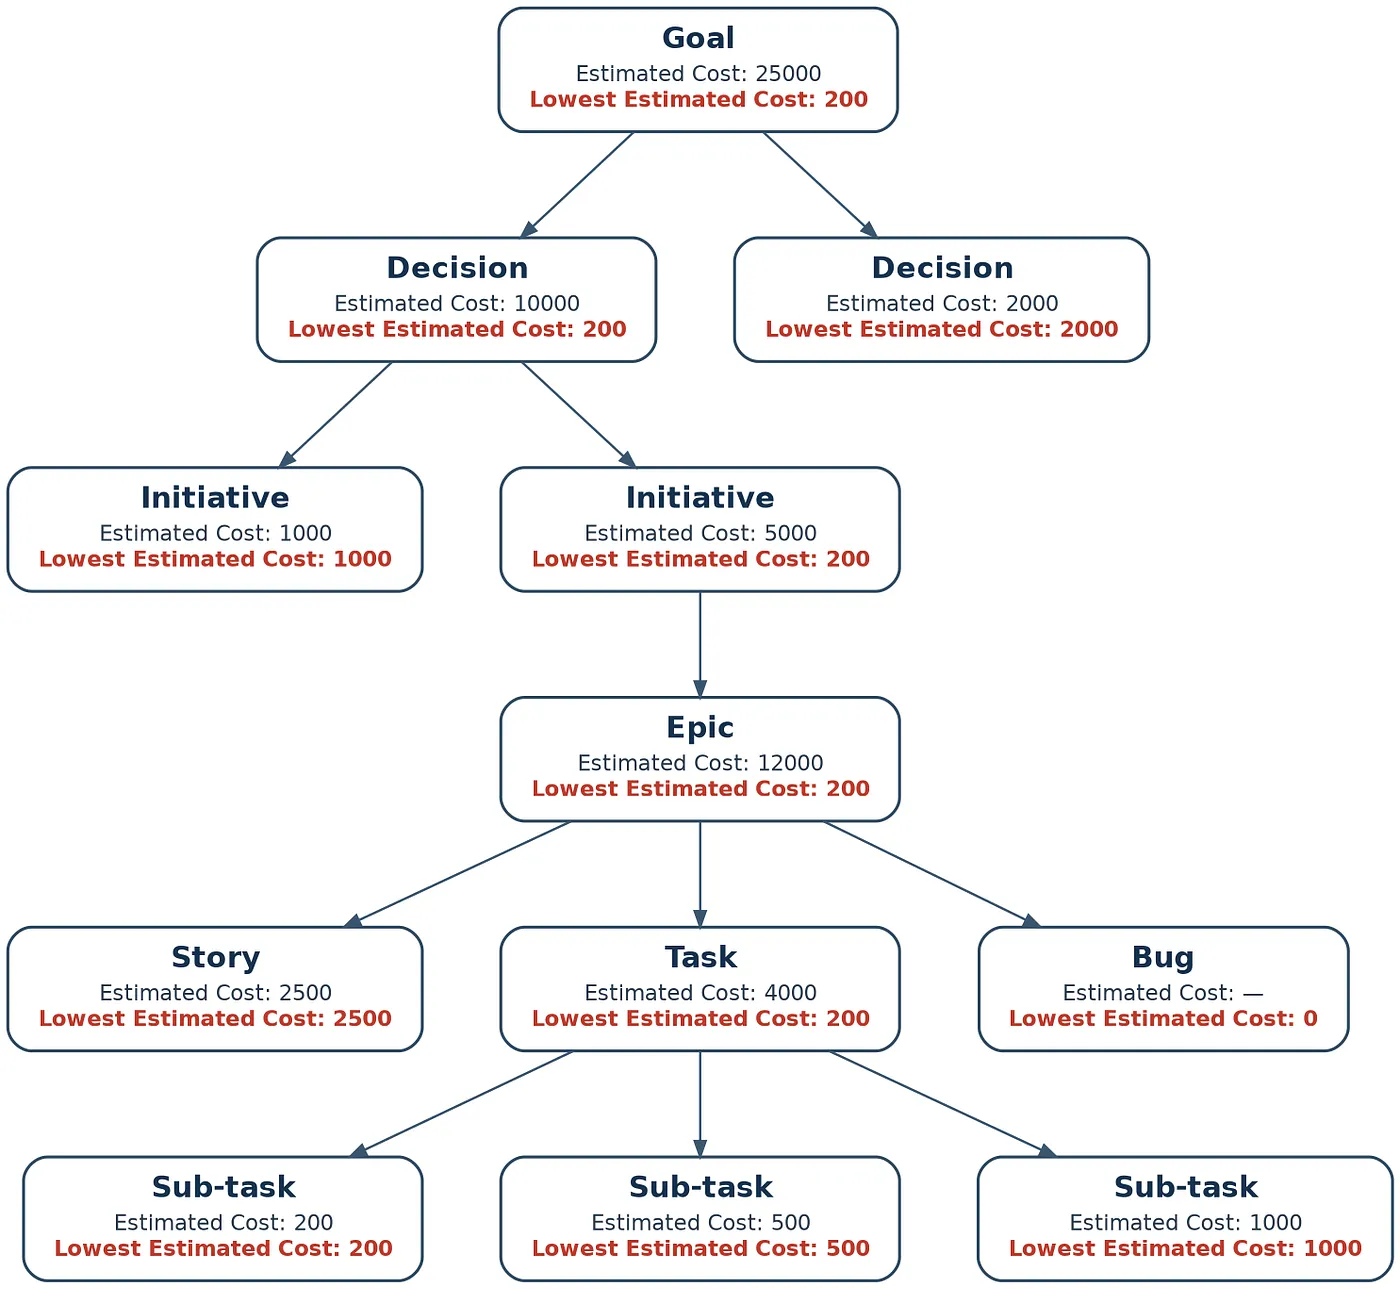
- The single smallest value anywhere in the tree.
- Goal Lowest Estimated Cost: 200
COUNT:
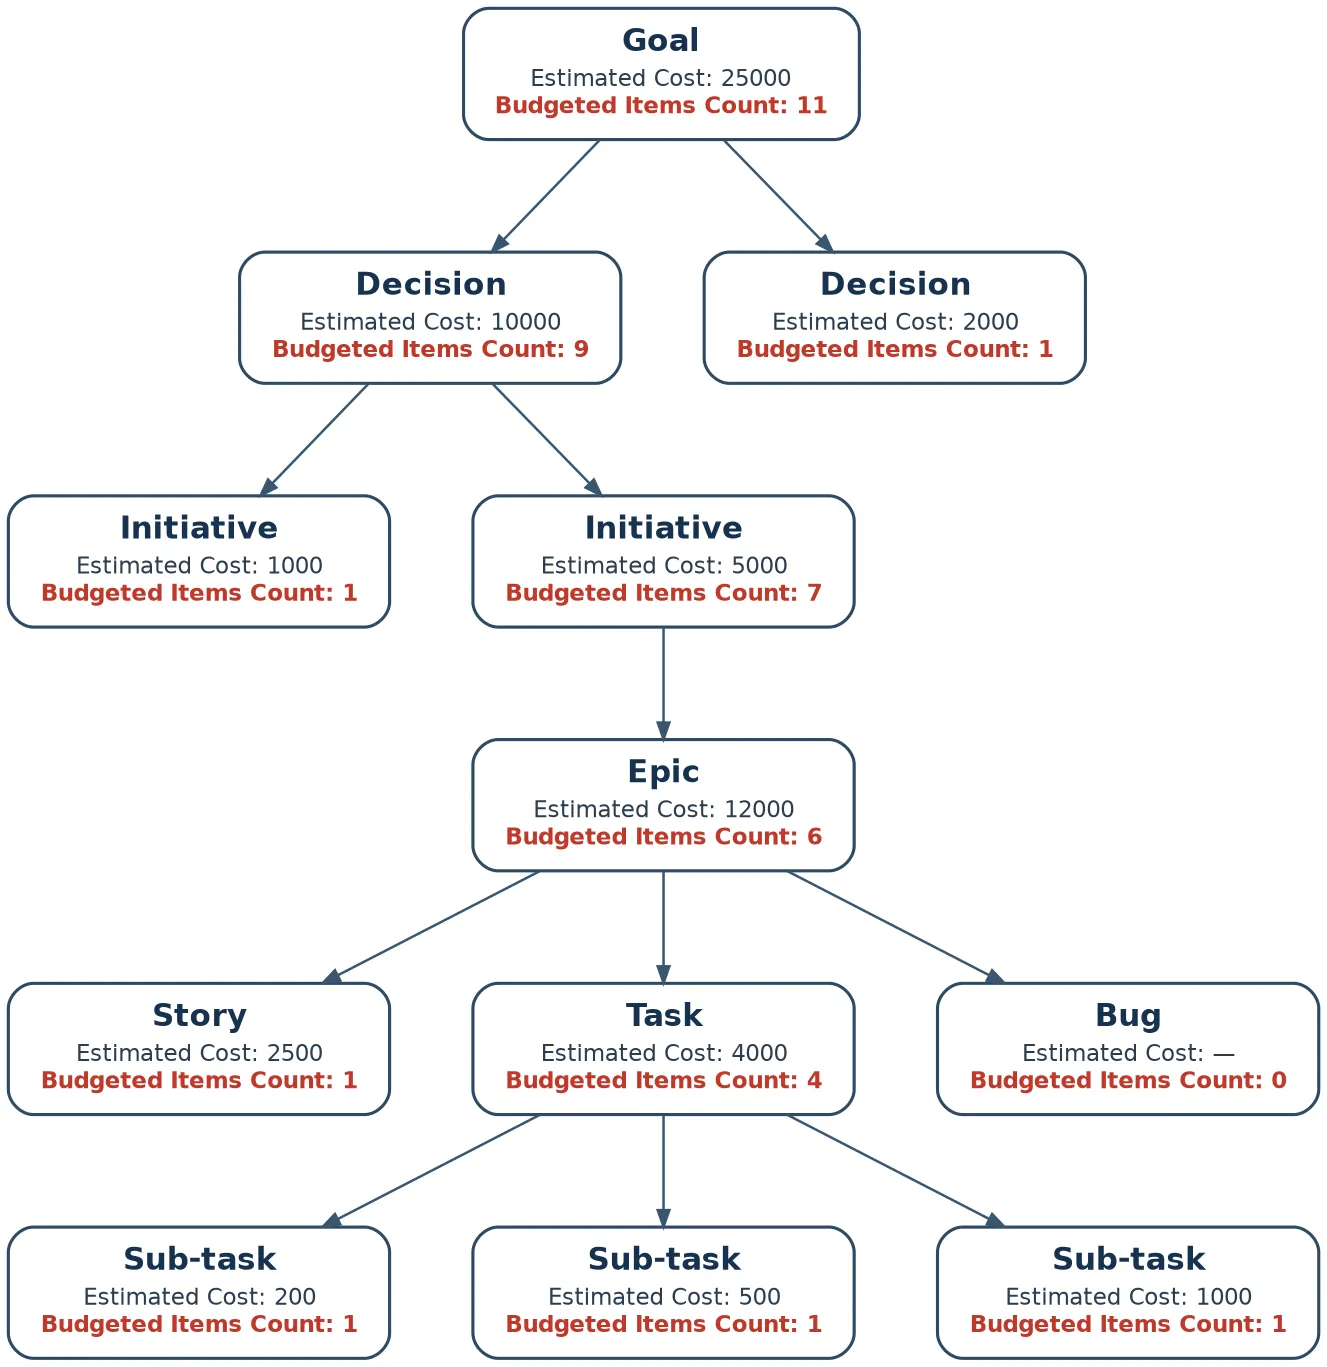
- How many issues actually have a cost, so the empty issues are left out.
- Goal Budgeted Items Count: 11
AVERAGE:
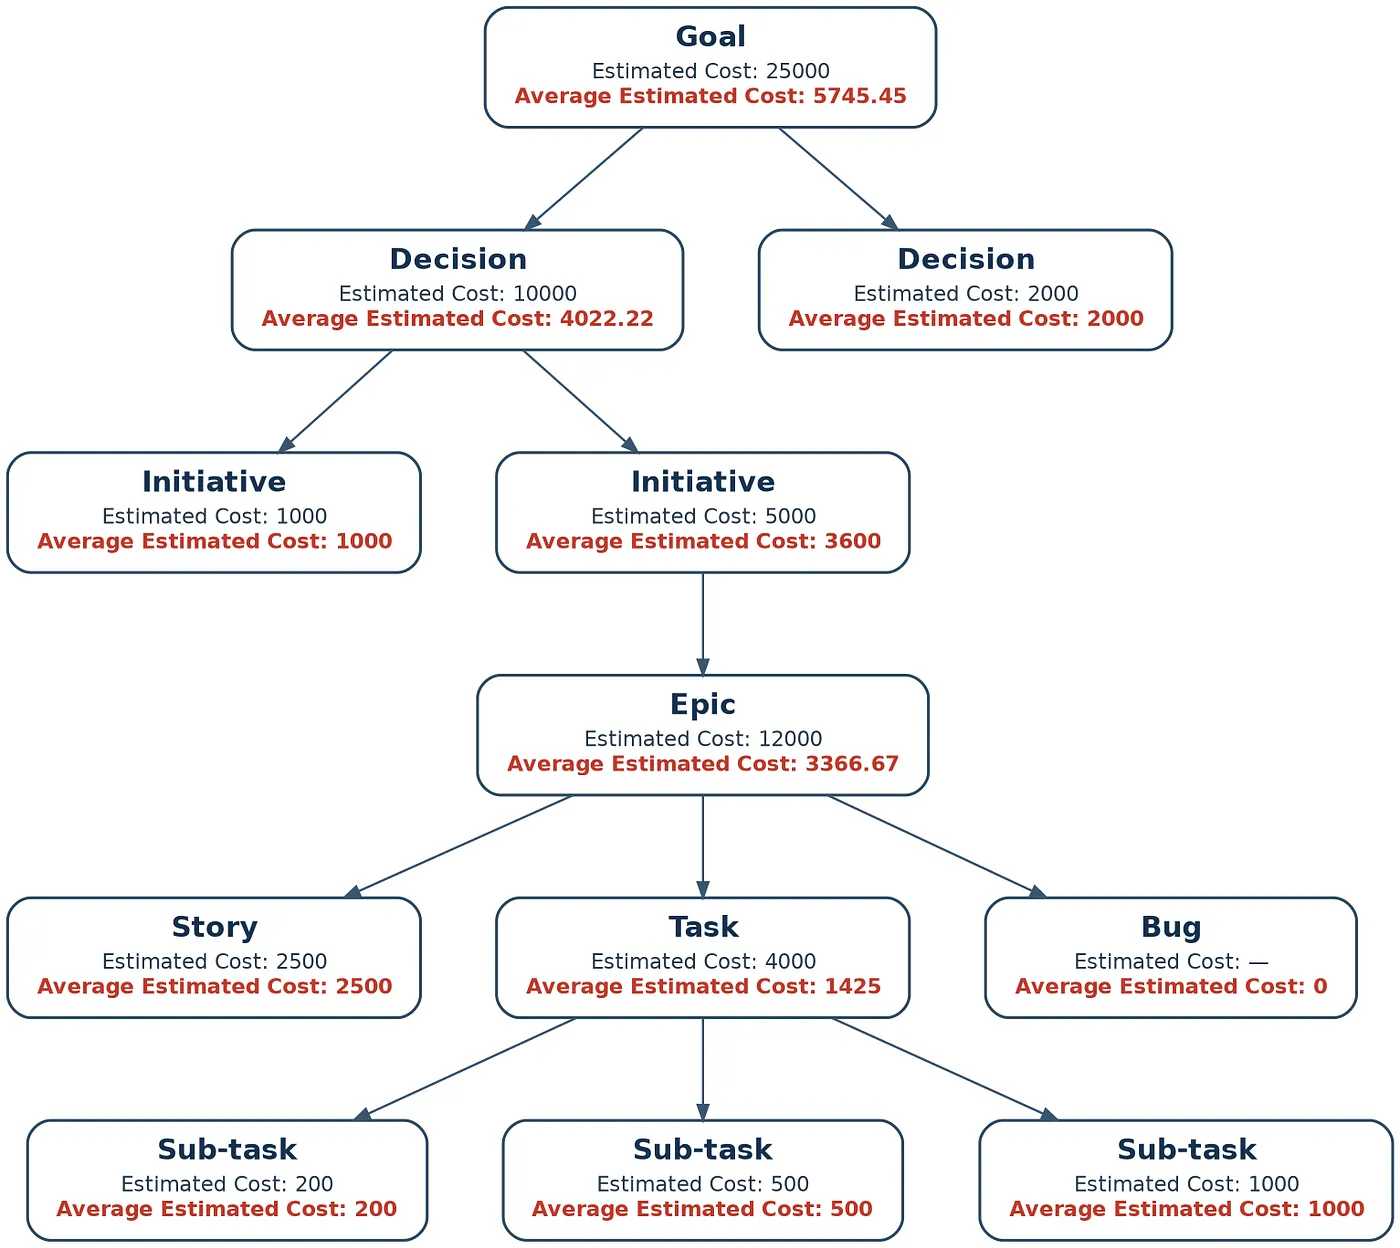
- The total divided by the number of issues that carry a value.
- Goal Average Estimated Cost: 5,745.45
- One detail worth knowing before you pick Average: it’s the one method that updates live on the issue view rather than through the one-time Calculate Issues pass from our last post. Average reflects the issues underneath it as they change from the point you switch to it, rather than backfilling history in a single bulk run.
Notice what the empty Bug does, or rather doesn’t do. It never counts as a zero, so it stays out of both the Average and the Count, exactly what you want: a line nobody has costed yet shouldn’t drag your typical figure down or make the plan look more complete than it is. The method changes the meaning, not just the math.
Watching it work: the same plan, a sharper question
Back on the EU Market plan example of the previous post, the Total Estimated Cost of 63,200 was the number that got the budget signed off. A total quietly assumes every line is filled in, though, and this plan’s Bug never had an Estimated Cost entered. Point a second Sum-up field at the same Estimated Cost, set the method to Count, and the Goal shows 11, not 12. That one-number gap is the difference between “the plan costs 63,200” and “the plan costs at least 63,200, with one estimate still outstanding,” and it’s the fastest way to know how much to trust the total before you carry it into a meeting.
The other methods answer questions the total can’t. Set the method to Max and the Goal returns 25,000, the single largest estimate in the plan and, on its own, close to 40% of the whole budget, which is the kind of concentration worth seeing before you commit. Min returns 200, the smallest line and a candidate quick win. Average returns 5,745.45, the typical cost per item, which is the quickest way to spot the one or two lines sitting far above it. Same field, same hierarchy, five different answers, and the only thing that changed was the method on the configuration screen.
Which method answers which question
If you’re deciding which method to put on a given field, it usually comes down to the shape of the question, not the field itself. Here’s how the five tend to map to real reporting needs:
Try the Sum-up Custom Field on the Atlassian Marketplace and pick the calculation method that actually answers your question, not just the one that adds things up.